Prometheus
Time-series monitoring and alerting, the de-facto standard for cloud-native systems.
What it is
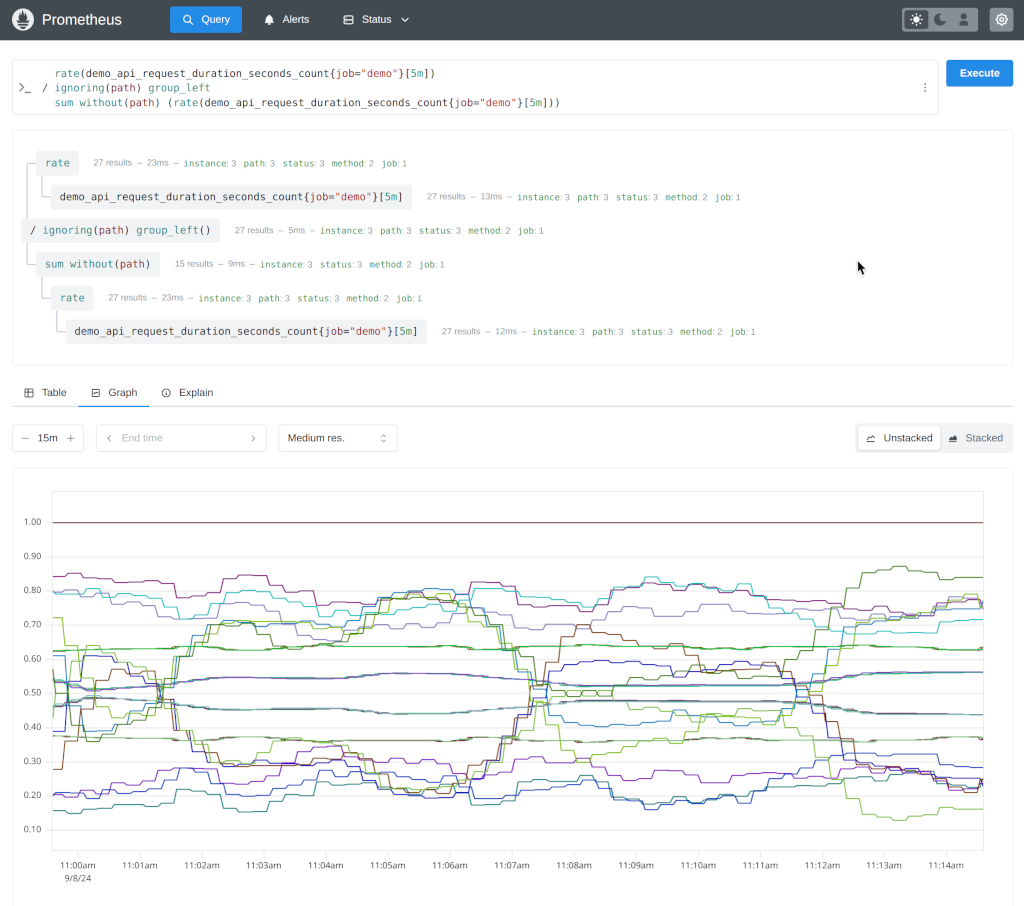
Prometheus is a monitoring and alerting system with a time-series database. It scrapes HTTP endpoints, stores metrics, and queries them with PromQL, with flexible alerting rules. It is the de-facto standard for container and Kubernetes environments and is usually paired with Grafana.
Problems it solves
- You run containers or Kubernetes and need metrics built for that world.
- You want a query language expressive enough for real alerting logic.
How administrators use it
- Scrape exporters and application /metrics endpoints on an interval.
- Write PromQL alert rules and hand dashboards to Grafana.
Strengths & trade-offs
Strengths
- Standard for cloud-native monitoring.
- Powerful PromQL.
- Huge exporter ecosystem.
Trade-offs
- Pull model and long-term storage need planning.
- Best paired with Grafana for visuals.
Questions
Does Prometheus need Grafana?
Not strictly, but most teams pair it with Grafana for dashboards; Prometheus itself focuses on collection and alerting.
Is Prometheus useful outside Kubernetes?
Yes — it shines in container and cloud-native setups but can scrape any HTTP metrics endpoint.
Alternatives
Visualisation and dashboards over Prometheus, Zabbix, databases and clouds.
Open-source monitoring for servers, network gear, VMs and applications.
Cloud observability — metrics, traces and logs — with no monitoring servers to run.